In the visualizations we created, our dashboard is specialized in representing Crime Data from the year
of 2020 to the present. The code focuses on specific columns: 'Crm Cd Desc' (crime description),
'TIME OCC' (time of occurrence), 'LON' (longitude), and 'LAT' (latitude). Any rows with missing
values in these columns are removed. Additionally, rows where latitude or longitude are zero
are filtered out, as these likely represent invalid locations. This code samples a subset of 4900 data
points randomly for analysis and visualization purposes. The code extracts the hour of occurrence from
the 'TIME OCC' column by dividing the values by 100 (assuming 'TIME OCC' is stored in a format like 'HHMM').

This creates a new column named 'HOUR'. A dropdown menu is created using Altair's binding_select feature,
allowing the user to interactively select a specific crime type from the available options within the dataset.
Our code we created for our visualization also generates a histogram visualization using Altair. This histogram
displays the distribution of crimes across different hours of the day for the selected crime type. The x-axis
represents the hour of the day, divided into 24 bins, and the y-axis shows the count of crimes occurring within
each hour. The histogram is colored red for visual clarity. This code connects to the selections made in relation
to the Crime Locations dashboard.
As part of our Contextual Visualization, we look into a dataset of The Boston Crime Incident Reports
(2023 to Present). This dataset offers a focused view of recent crime patterns within a single city,
which can be contrasted with the broader national crime data from 2020 to present in the main dataset.
This localized perspective enables exploration of how crime trends in Boston align with or diverge
from national patterns, providing depth and specificity to the final analysis.
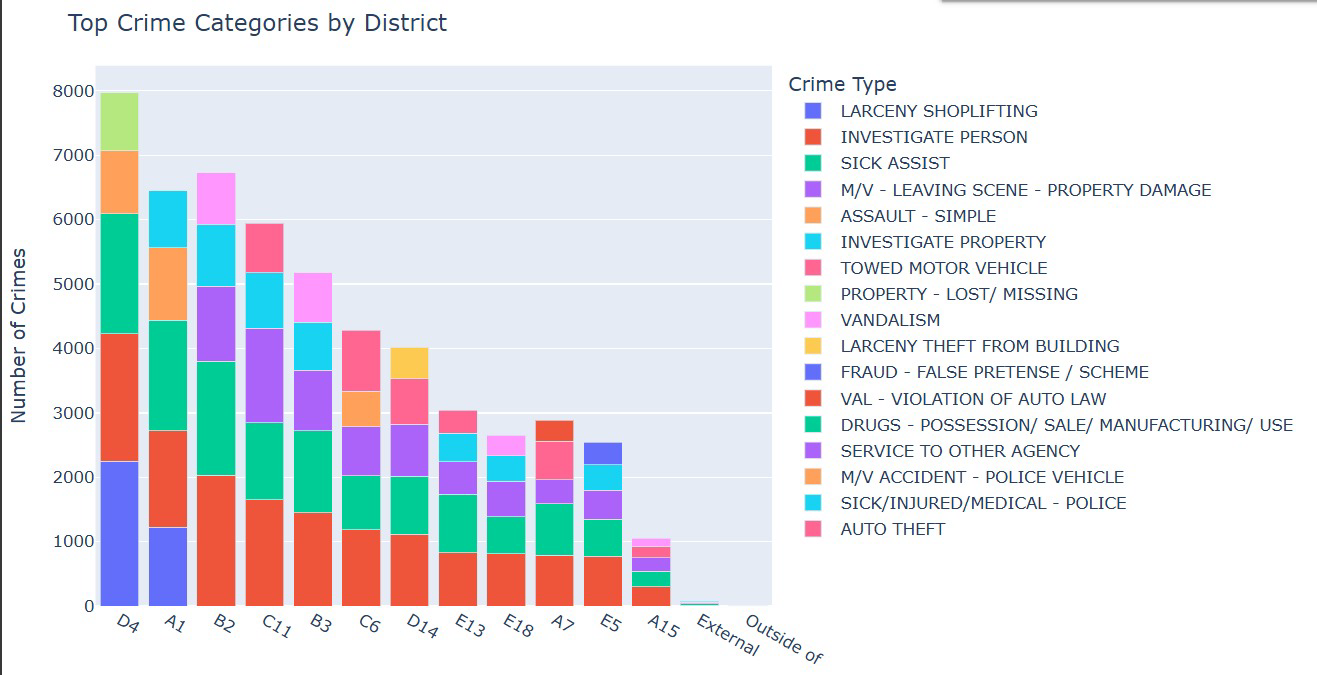
The visualizations we include offer insights into the multifaceted nature of crime patterns. The first
image, showing "Top Crime Categories by District," reveals a diverse landscape of criminal activity across
different geographical areas. Notably, "Larceny Shoplifting" stands out in District D4, while "Investigate
Person" dominates in District A1. This variation suggests that crime trends are influenced by local factors
such as socio-economic conditions and demographics.
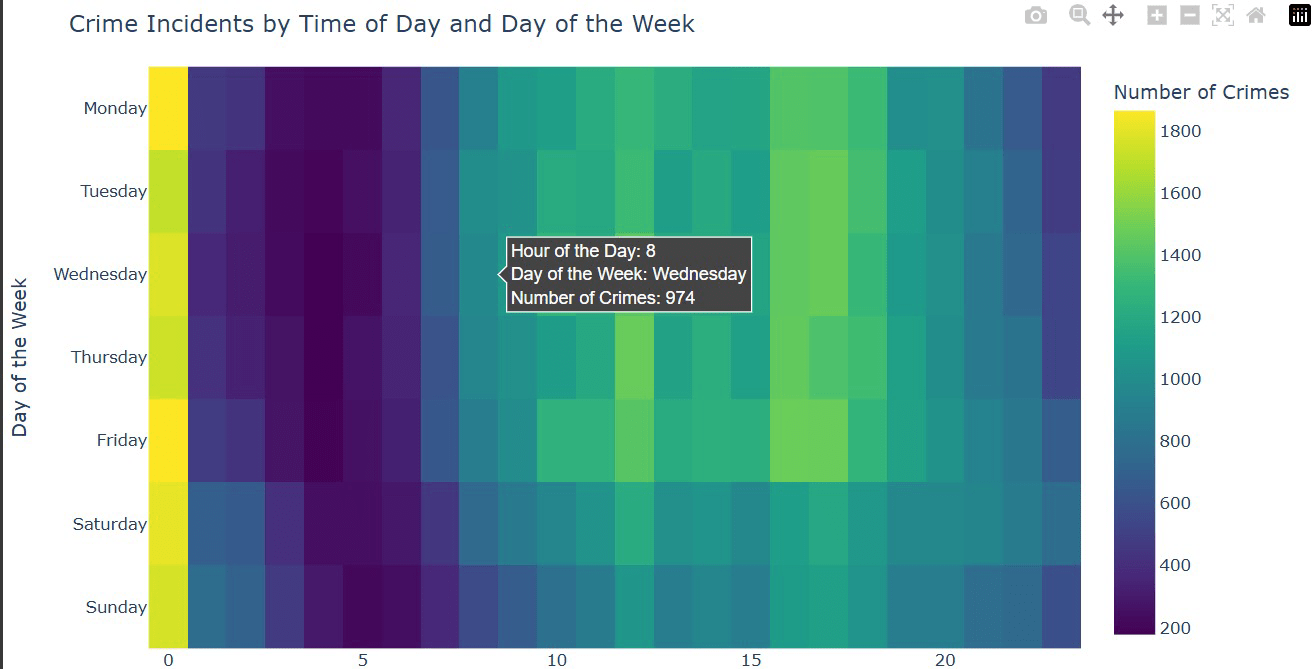
The second image, displaying "Crime Incidents by Time of Day and Day of the Week," highlights the temporal
patterns. Weekdays generally show an increase in incidents towards the evening, possibly linked to people
leaving work. In contrast, weekends exhibit a more consistent level of crime. Specific days like Wednesday
demonstrate pronounced peaks at certain hours, indicating potential influences from routine changes or
specific events. These variations underscore the importance of considering time-related factors in understanding
crime trends. Overall, the analysis suggests that crime is a complex phenomenon influenced by a dynamic interplay
of geographical, temporal, and socio-economic factors.
Crime Incident Reports (August 2015 - to Date) (Source: New System) - Dataset - Analyze Boston, data.boston.gov/dataset/crime-incident-reports-august-2015-to-date-source-new-system. Accessed 12 Dec. 2024.
Link: https://data.boston.gov/dataset/crime-incident-reports-august-2015-to-date-source-new-system/resource/b973d8cb-eeb2-4e7e-99da-c92938efc9c0
Main Visualization - Los Angeles Police Department. "Crime Data from 2020 to Present." City of Los Angeles Open Data Portal, https://data.lacity.org/Public-Safety/Crime-Data-from-2020-to-Present/2nrs-mtv8. Accessed [18 Dec. 2024].
Link: https://data.lacity.org/Public-Safety/Crime-Data-from-2020-to-Present/2nrs-mtv8/about_data